佳礼资讯网

 找回密码
 注册

ADVERTISEMENT

楼主: 江百虎

万能公式 + 強勢投資 + 基金轉換 + ChartNexus 選股方法

  [复制链接]
发表于 3-7-2008 04:03 PM | 显示全部楼层

回复 178# 江百虎 的帖子

也就是说,只要选择一家好好公司,然后用100天線穿200日線來做買賣,不只操作次数少,獲利还是最高的??


该怎么看?

[ 本帖最后由 ThermoFisher 于 3-7-2008 04:10 PM 编辑 ]
回复

使用道具 举报


ADVERTISEMENT

 楼主| 发表于 3-7-2008 04:10 PM | 显示全部楼层
原帖由 ThermoFisher 于 3-7-2008 04:03 PM 发表
也就是说,只要选择一家好好公司,然后用100天線穿200日線來做買賣,不只操作次数少,獲利还是最高的??  


理論上是如此羅。。。

不過還要看不同股票的股性。。。

剛剛 scan 了 POS 一下。。。資料應該是有問題呱。。。獲利實在是嚇死人啊。。。

Buy Rule:"MA Dual Crossover 100 200"
(R1)
where
R1=MA Dual Crossover
    Shorter Period=100
    Longer Period=200
    Exponential=yes
    Black Window=3
    t1=3
    t2=3
    Rule Type=Daily
    Data Type=Completed


Sell Rule:"MA Dual Crossover 100 200"
(R1)
where
R1=MA Dual Crossover
    Shorter Period=100
    Longer Period=200
    Exponential=yes
    Black Window=3
    t1=3
    t2=3
    Rule Type=Daily
    Data Type=Completed


Statistics:
Initial capital    10000.00
Cash on hand    2816124.34
Final capital (all positions closed)    2816124.34
Capital available    2816124.34
Return on trades (%)    28061.24
Return on capital (%)    28061.24
Open positions    0
Total net profit/loss    2806124.33
Highest portfolio value    2816122.4
Open position profit/loss    0.0
% of profitable trades    66.66
Total number of trades    3
Total commission paid    12051.66

Profitable Trades:
Profit of profitable trades    2808066.64
Total profitable trades    2
Average profit    1404033.32
Largest profit    2805979.98
Smallest profit    2086.66
Largest profitable trade commission    11920.02
Commission paid for profitable trades    11993.35
Avg. commission paid for profitable trades    5996.67
Profitable long trades    2
Profitable short trades    0

Unprofitable Trades:
Loss of unprofitable trades    -1942.32
Total unprofitable trades    1
Average loss    -1942.32
Largest loss    -1942.32
Smallest loss    -1942.32
Largest loser commission    58.31
Commission paid for unprofitable trades    58.31
Avg. commission paid for unprofitable trades    58.31
Unprofitable long trades    1
Unprofitable short trades    0


No.    Stock Name    Triggerred Date    Shares    Price    Profit/Loss    Triggerred Rules
1    POS    26 Mar 1996    3000    2.628    0.0    BUY - ((Shorter MA crossed over longer MA))
2    POS    4 Sep 1997    3000    2.0    -1942.313    SELL - ((Longer MA crossed over shorter MA))
3    POS    19 May 1999    9000    0.85    0.0    BUY - ((Shorter MA crossed over longer MA))
4    POS    19 Jul 2000    9000    1.089    2086.667    SELL - ((Longer MA crossed over shorter MA))
5    POS    24 Jul 2003    1010000    0.01    0.0    BUY - ((Shorter MA crossed over longer MA))
6    POS    11 Jun 2007    1010000    2.8    2805979.98    SELL - ((Longer MA crossed over shorter MA))


回复

使用道具 举报

 楼主| 发表于 3-7-2008 04:13 PM | 显示全部楼层
原帖由 ThermoFisher 于 3-7-2008 04:03 PM 发表
也就是说,只要选择一家好好公司,然后用100天線穿200日線來做買賣,不只操作次数少,獲利还是最高的??

该怎么看?  


其實像  pbbbank 這樣的股票。。。股價長期一直在上漲的真的不太多咧。。。什么時候買都沒有問題的。。。

非常的難得的。。。
回复

使用道具 举报

发表于 3-7-2008 04:14 PM | 显示全部楼层

回复 182# 江百虎 的帖子

上面有一个问题——就是有一个买价在0.01
然后卖在2.8
资料问题吗?
回复

使用道具 举报

发表于 3-7-2008 04:31 PM | 显示全部楼层

回复 177# 江百虎 的帖子

江师傅,请问PBB如果在1994年买,2008年才卖,大概有多少巴仙报酬。
回复

使用道具 举报

 楼主| 发表于 3-7-2008 05:24 PM | 显示全部楼层
原帖由 kcthye 于 3-7-2008 04:31 PM 发表
江师傅,请问PBB如果在1994年买,2008年才卖,大概有多少巴仙报酬。


如果是 100 - 200 天的話是負報酬。。。因為最新最大的一次上漲還沒有結束計算出來。。。。不過  ChartNexus 所統計出來的結果好像有些錯誤。。。

如果是用 50 - 100 天的話就是 458.88% 。。。

這就說明了 2001 年之前  PPB 并沒有一次大規模的上漲。。。2001 年 7 月開始的大規模的上漲到現在都還沒有結束羅。。。 1.029 的股價到今天已經是 10.7 了。。。7 年起了 10 倍咧。。。


Buy Rule:"MA Dual Crossover 100 200"
(R1)
where
R1=MA Dual Crossover
    Shorter Period=100
    Longer Period=200
    Exponential=yes
    Black Window=3
    t1=3
    t2=3
    Rule Type=Daily
    Data Type=Completed


Sell Rule:"MA Dual Crossover 100 200"
(R1)
where
R1=MA Dual Crossover
    Shorter Period=100
    Longer Period=200
    Exponential=yes
    Black Window=3
    t1=3
    t2=3
    Rule Type=Daily
    Data Type=Completed


Statistics:
Initial capital    10000.00
Cash on hand    263.50
Final capital (all positions closed)    64193.86
Capital available    263.50
Return on trades (%)    -35.31
Return on capital (%)    541.93
Open positions    1
Total net profit/loss    -3530.55
Highest portfolio value    9851.2
Open position profit/loss    57724.4
% of profitable trades    33.33
Total number of trades    3
Total commission paid    220.49

Profitable Trades:
Profit of profitable trades    494.59
Total profitable trades    1
Average profit    494.59
Largest profit    494.59
Smallest profit    494.59
Largest profitable trade commission    69.4
Commission paid for profitable trades    69.4
Avg. commission paid for profitable trades    69.4
Profitable long trades    1
Profitable short trades    0

Unprofitable Trades:
Loss of unprofitable trades    -4025.15
Total unprofitable trades    2
Average loss    -2012.58
Largest loss    -3111.63
Smallest loss    -913.52
Largest loser commission    69.62
Commission paid for unprofitable trades    125.14
Avg. commission paid for unprofitable trades    62.57
Unprofitable long trades    2
Unprofitable short trades    0


No.    Stock Name    Triggerred Date    Shares    Price    Profit/Loss    Triggerred Rules
1    PPB    27 Feb 1996    4000    1.994    0.0    BUY - ((Shorter MA crossed over longer MA))
2    PPB    6 Jun 1997    4000    2.135    494.599    SELL - ((Longer MA crossed over shorter MA))
3    PPB    10 Jun 1999    9000    1.089    0.0    BUY - ((Shorter MA crossed over longer MA))
4    PPB    16 Aug 1999    9000    0.751    -3111.628    SELL - ((Longer MA crossed over shorter MA))
5    PPB    17 Jan 2000    6000    1.172    0.0    BUY - ((Shorter MA crossed over longer MA))
6    PPB    1 Sep 2000    6000    1.029    -913.516    SELL - ((Longer MA crossed over shorter MA))
7    PPB    31 Jul 2001    6000    1.029    0.0    BUY - ((Shorter MA crossed over longer MA))


Buy Rule:"MA Dual Crossover 50 100"
(R1)
where
R1=MA Dual Crossover
    Shorter Period=50
    Longer Period=100
    Exponential=yes
    Black Window=3
    t1=3
    t2=3
    Rule Type=Daily
    Data Type=Completed


Sell Rule:"MA Dual Crossover 50 100"
(R1)
where
R1=MA Dual Crossover
    Shorter Period=50
    Longer Period=100
    Exponential=yes
    Black Window=3
    t1=3
    t2=3
    Rule Type=Daily
    Data Type=Completed


Statistics:
Initial capital    10000.00
Cash on hand    2613.62
Final capital (all positions closed)    55888.92
Capital available    2613.62
Return on trades (%)    118.94
Return on capital (%)    458.88
Open positions    1
Total net profit/loss    11894.26
Highest portfolio value    23978.86
Open position profit/loss    33994.66
% of profitable trades    50.0
Total number of trades    10
Total commission paid    1059.37

Profitable Trades:
Profit of profitable trades    18755.16
Total profitable trades    5
Average profit    3751.03
Largest profit    8561.81
Smallest profit    310.23
Largest profitable trade commission    118.18
Commission paid for profitable trades    515.83
Avg. commission paid for profitable trades    103.16
Profitable long trades    5
Profitable short trades    0

Unprofitable Trades:
Loss of unprofitable trades    -6860.9
Total unprofitable trades    5
Average loss    -1372.18
Largest loss    -2575.4
Smallest loss    -370.93
Largest loser commission    175.39
Commission paid for unprofitable trades    462.89
Avg. commission paid for unprofitable trades    92.57
Unprofitable long trades    5
Unprofitable short trades    0


No.    Stock Name    Triggerred Date    Shares    Price    Profit/Loss    Triggerred Rules
1    PPB    10 Jul 1995    5000    1.845    0.0    BUY - ((Shorter MA crossed over longer MA))
2    PPB    13 Sep 1995    5000    1.74    -600.327    SELL - ((Longer MA crossed over shorter MA))
3    PPB    18 Jan 1996    5000    1.755    0.0    BUY - ((Shorter MA crossed over longer MA))
4    PPB    11 Oct 1996    5000    2.098    1634.045    SELL - ((Longer MA crossed over shorter MA))
5    PPB    26 Feb 1997    4000    2.266    0.0    BUY - ((Shorter MA crossed over longer MA))
6    PPB    7 May 1997    4000    2.192    -370.928    SELL - ((Longer MA crossed over shorter MA))
7    PPB    26 Jan 1999    9000    1.074    0.0    BUY - ((Shorter MA crossed over longer MA))
8    PPB    8 Mar 1999    9000    0.841    -2169.463    SELL - ((Longer MA crossed over shorter MA))
9    PPB    21 Apr 1999    9000    0.916    0.0    BUY - ((Shorter MA crossed over longer MA))
10    PPB    13 Aug 1999    9000    0.796    -1144.79    SELL - ((Longer MA crossed over shorter MA))
11    PPB    23 Dec 1999    7000    1.006    0.0    BUY - ((Shorter MA crossed over longer MA))
12    PPB    21 Jun 2000    7000    1.059    310.23    SELL - ((Longer MA crossed over shorter MA))
13    PPB    15 Jun 2001    8000    0.909    0.0    BUY - ((Shorter MA crossed over longer MA))
14    PPB    13 Mar 2003    8000    1.329    3284.736    SELL - ((Longer MA crossed over shorter MA))
15    PPB    26 Mar 2003    7000    1.389    0.0    BUY - ((Shorter MA crossed over longer MA))
16    PPB    9 Jun 2004    7000    2.629    8561.812    SELL - ((Longer MA crossed over shorter MA))
17    PPB    9 Dec 2004    7000    2.704    0.0    BUY - ((Shorter MA crossed over longer MA))
18    PPB    8 Mar 2006    7000    3.439    4964.337    SELL - ((Longer MA crossed over shorter MA))
19    PPB    3 Apr 2006    6000    3.679    0.0    BUY - ((Shorter MA crossed over longer MA))
20    PPB    13 Jun 2006    6000    3.279    -2575.392    SELL - ((Longer MA crossed over shorter MA))
21    PPB    17 Aug 2006    5000    3.839    0.0    BUY - ((Shorter MA crossed over longer MA))


[ 本帖最后由 江百虎 于 3-7-2008 05:26 PM 编辑 ]
回复

使用道具 举报

Follow Us
 楼主| 发表于 3-7-2008 05:29 PM | 显示全部楼层
原帖由 蚂蚁小弟 于 3-7-2008 04:14 PM 发表
上面有一个问题——就是有一个买价在0.01
然后卖在2.8
资料问题吗?


資料太多了。。。錯誤在所難免呱。。。

拿來參考就好了。。。
回复

使用道具 举报

发表于 3-7-2008 05:45 PM | 显示全部楼层

回复 186# 江百虎 的帖子

江师傅,别把PPB和PBB给搞错了,哈哈。。。
回复

使用道具 举报


ADVERTISEMENT

 楼主| 发表于 3-7-2008 05:54 PM | 显示全部楼层
原帖由 ThermoFisher 于 3-7-2008 05:45 PM 发表
江师傅,别把PPB和PBB给搞错了,哈哈。。。


呵呵。。。PBB 的前面已經弄過了呱。。。
回复

使用道具 举报

 楼主| 发表于 3-7-2008 05:58 PM | 显示全部楼层
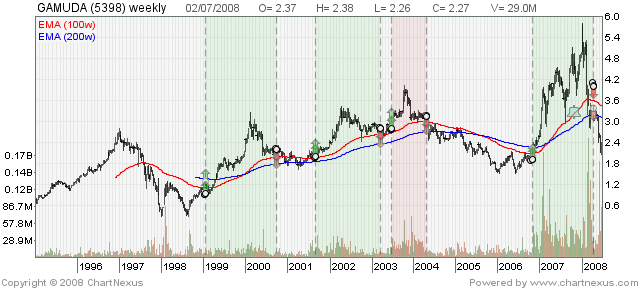
GAMUDA 的統計。。。

即使突然間暴跌。。。可是從起點開始買起的話還是有賺哦。。。


Buy Rule:"MA Dual Crossover 100 200"
(R1)
where
R1=MA Dual Crossover
    Shorter Period=100
    Longer Period=200
    Exponential=yes
    Black Window=3
    t1=3
    t2=3
    Rule Type=Daily
    Data Type=Completed


Sell Rule:"MA Dual Crossover 100 200"
(R1)
where
R1=MA Dual Crossover
    Shorter Period=100
    Longer Period=200
    Exponential=yes
    Black Window=3
    t1=3
    t2=3
    Rule Type=Daily
    Data Type=Completed


Statistics:
Initial capital    10000.00
Cash on hand    27725.35
Final capital (all positions closed)    27725.35
Capital available    27725.35
Return on trades (%)    177.25
Return on capital (%)    177.25
Open positions    0
Total net profit/loss    17725.34
Highest portfolio value    26767.1
Open position profit/loss    0.0
% of profitable trades    75.0
Total number of trades    4
Total commission paid    522.15

Profitable Trades:
Profit of profitable trades    18101.34
Total profitable trades    3
Average profit    6033.78
Largest profit    10699.9
Smallest profit    2580.29
Largest profitable trade commission    180.09
Commission paid for profitable trades    396.15
Avg. commission paid for profitable trades    132.05
Profitable long trades    3
Profitable short trades    0

Unprofitable Trades:
Loss of unprofitable trades    -376.0
Total unprofitable trades    1
Average loss    -376.0
Largest loss    -376.0
Smallest loss    -376.0
Largest loser commission    126.0
Commission paid for unprofitable trades    126.0
Avg. commission paid for unprofitable trades    126.0
Unprofitable long trades    1
Unprofitable short trades    0


No.    Stock Name    Triggerred Date    Shares    Price    Profit/Loss    Triggerred Rules
1    GAMUDA    25 Jan 1999    7000    1.287    0.0    BUY - ((Shorter MA crossed over longer MA))
2    GAMUDA    28 Sep 2000    7000    1.99    4821.141    SELL - ((Longer MA crossed over shorter MA))
3    GAMUDA    5 Sep 2001    6000    2.15    0.0    BUY - ((Shorter MA crossed over longer MA))
4    GAMUDA    18 Mar 2003    6000    2.6    2580.299    SELL - ((Longer MA crossed over shorter MA))
5    GAMUDA    23 Jun 2003    5000    3.025    0.0    BUY - ((Shorter MA crossed over longer MA))
6    GAMUDA    23 Apr 2004    5000    2.975    -376.0    SELL - ((Longer MA crossed over shorter MA))
7    GAMUDA    26 Oct 2006    8000    2.0    0.0    BUY - ((Shorter MA crossed over longer MA))
8    GAMUDA    10 Apr 2008    8000    3.36    10699.903    SELL - ((Longer MA crossed over shorter MA))


回复

使用道具 举报

 楼主| 发表于 3-7-2008 06:16 PM | 显示全部楼层
megan 。。。

100 上穿  200 天的是負報酬。。。

50 上穿 100 天的有賺。。。

其實不管一只股票的基本面是如何。。。如果技術面已經真的是不行了的話。。。暫時出場觀望會是更好的選擇呱???!!!。。。


Buy Rule:"MA Dual Crossover 100 200"
(R1)
where
R1=MA Dual Crossover
    Shorter Period=100
    Longer Period=200
    Exponential=yes
    Black Window=3
    t1=3
    t2=3
    Rule Type=Daily
    Data Type=Completed


Sell Rule:"MA Dual Crossover 100 200"
(R1)
where
R1=MA Dual Crossover
    Shorter Period=100
    Longer Period=200
    Exponential=yes
    Black Window=3
    t1=3
    t2=3
    Rule Type=Daily
    Data Type=Completed


Statistics:
Initial capital        10000.00
Cash on hand        8843.05
Final capital (all positions closed)        8843.05
Capital available        8843.05
Return on trades (%)        -11.57
Return on capital (%)        -11.57
Open positions        0
Total net profit/loss        -1156.96
Highest portfolio value        9806.63
Open position profit/loss        0.0
% of profitable trades        50.0
Total number of trades        2
Total commission paid        149.95

Profitable Trades:
Profit of profitable trades        286.82
Total profitable trades        1
Average profit        286.82
Largest profit        286.82
Smallest profit        286.82
Largest profitable trade commission        81.17
Commission paid for profitable trades        81.17
Avg. commission paid for profitable trades        81.17
Profitable long trades        1
Profitable short trades        0

Unprofitable Trades:
Loss of unprofitable trades        -1443.78
Total unprofitable trades        1
Average loss        -1443.78
Largest loss        -1443.78
Smallest loss        -1443.78
Largest loser commission        68.77
Commission paid for unprofitable trades        68.77
Avg. commission paid for unprofitable trades        68.77
Unprofitable long trades        1
Unprofitable short trades        0


No.        Stock Name        Triggerred Date        Shares        Price        Profit/Loss        Triggerred Rules
1        MEGAN        10 Dec 2001        8000        1.185        0.0        BUY - ((Shorter MA crossed over longer MA))
2        MEGAN        26 Feb 2003        8000        1.231        286.822        SELL - ((Longer MA crossed over shorter MA))
3        MEGAN        14 Jul 2003        5000        1.775        0.0        BUY - ((Shorter MA crossed over longer MA))
4        MEGAN        19 Jul 2004        5000        1.5        -1443.775        SELL - ((Longer MA crossed over shorter MA))


Buy Rule:"MA Dual Crossover 50 100"
(R1)
where
R1=MA Dual Crossover
    Shorter Period=50
    Longer Period=100
    Exponential=yes
    Black Window=3
    t1=3
    t2=3
    Rule Type=Daily
    Data Type=Completed


Sell Rule:"MA Dual Crossover 50 100"
(R1)
where
R1=MA Dual Crossover
    Shorter Period=50
    Longer Period=100
    Exponential=yes
    Black Window=3
    t1=3
    t2=3
    Rule Type=Daily
    Data Type=Completed


Statistics:
Initial capital    10000.00
Cash on hand    16207.16
Final capital (all positions closed)    16207.16
Capital available    16207.16
Return on trades (%)    62.07
Return on capital (%)    62.07
Open positions    0
Total net profit/loss    6207.16
Highest portfolio value    17101.52
Open position profit/loss    0.0
% of profitable trades    66.66
Total number of trades    3
Total commission paid    349.83

Profitable Trades:
Profit of profitable trades    7644.75
Total profitable trades    2
Average profit    3822.37
Largest profit    4324.81
Smallest profit    3319.93
Largest profitable trade commission    121.18
Commission paid for profitable trades    212.24
Avg. commission paid for profitable trades    106.12
Profitable long trades    2
Profitable short trades    0

Unprofitable Trades:
Loss of unprofitable trades    -1437.6
Total unprofitable trades    1
Average loss    -1437.6
Largest loss    -1437.6
Smallest loss    -1437.6
Largest loser commission    137.59
Commission paid for unprofitable trades    137.59
Avg. commission paid for unprofitable trades    137.59
Unprofitable long trades    1
Unprofitable short trades    0


No.    Stock Name    Triggerred Date    Shares    Price    Profit/Loss    Triggerred Rules
1    MEGAN    17 Aug 2001    9000    1.014    0.0    BUY - ((Shorter MA crossed over longer MA))
2    MEGAN    10 Oct 2002    9000    1.394    3319.939    SELL - ((Longer MA crossed over shorter MA))
3    MEGAN    19 Jun 2003    9000    1.356    0.0    BUY - ((Shorter MA crossed over longer MA))
4    MEGAN    27 May 2004    9000    1.85    4324.813    SELL - ((Longer MA crossed over shorter MA))
5    MEGAN    19 Jan 2007    26000    0.655    0.0    BUY - ((Shorter MA crossed over longer MA))
6    MEGAN    20 Mar 2007    26000    0.605    -1437.593    SELL - ((Longer MA crossed over shorter MA))


回复

使用道具 举报

发表于 3-7-2008 10:45 PM | 显示全部楼层

回复 186# 江百虎 的帖子

谢谢江师傅,虽然把PPB和PBB给搞错了。
我没有PBB1994年的股价所以才有此一问,
看到鱼大贴上的图,1994年的股价是大约RM3。00,现在RM10。2,就是说买了放到现在赚340%。(我有没有算错?〕
回复

使用道具 举报

发表于 3-7-2008 11:10 PM | 显示全部楼层

回复 192# kcthye 的帖子

PPB和PBBANK这两只股的走势很相似。。。。


回复

使用道具 举报

 楼主| 发表于 4-7-2008 12:42 AM | 显示全部楼层
原帖由 kcthye 于 3-7-2008 10:45 PM 发表
谢谢江师傅,虽然把PPB和PBB给搞错了。
我没有PBB1994年的股价所以才有此一问,
看到鱼大贴上的图,1994年的股价是大约RM3。00,现在RM10。2,就是说买了放到现在赚340%。(我有没有算错?〕


ChartNexus 的資料是從 1995 年開始的。。。

1995 年 1 月 3 日的股價是 1.707 。。。今天的股價是 10.2 。。。

13 年 6 個月的時間大概是起了  6 倍羅。。。

1 年的獲利率大約有  37% 左右羅。。。


[ 本帖最后由 江百虎 于 4-7-2008 12:49 AM 编辑 ]
回复

使用道具 举报

 楼主| 发表于 4-7-2008 12:43 AM | 显示全部楼层
原帖由 ThermoFisher 于 3-7-2008 11:10 PM 发表
PPB和PBBANK这两只股的走势很相似。。。。


呵呵。。。都是不用吃  tongkat ali 都一樣可以那么 “持久”的好股來的。。。

現在在看着 INIX 。。。不知道會不會是下一只黑馬呢。。。
回复

使用道具 举报

发表于 4-7-2008 09:40 AM | 显示全部楼层

回复 195# 江百虎 的帖子

什么原因百虎兄会看上0094?
小弟之前有买过。。。
0094的基本面很烂哦。。。
回复

使用道具 举报


ADVERTISEMENT

发表于 4-7-2008 04:11 PM | 显示全部楼层
迟些可能会试用Chartnexus半年,其实现在可能很难找到像万能公式里所说的股票了,
因为市场都在向下调整,现在能做可能只是捕捉反弹。不过要记得,
熊市的反弹一般都不太久,要见好就收。目前采取的方法是。。。
短期-5天Crossover20天。。。
中期-30天此rossover50或60天(看个股而定)
长期的就暂时没有方案。。。
回复

使用道具 举报

 楼主| 发表于 4-7-2008 04:40 PM | 显示全部楼层
原帖由 goodluck88 于 4-7-2008 09:40 AM 发表
什么原因百虎兄会看上0094?
小弟之前有买过。。。
0094的基本面很烂哦。。。


剛剛才在 KLSETRAKER 看了 INIX 的基本面。。。

還真的是有夠爛的。。。哈哈。。。

如果圖漂亮的話拿少少錢來賭一下就好羅。。。
回复

使用道具 举报

 楼主| 发表于 4-7-2008 04:50 PM | 显示全部楼层
原帖由 No.AMD 于 4-7-2008 04:11 PM 发表
迟些可能会试用Chartnexus半年,其实现在可能很难找到像万能公式里所说的股票了,
因为市场都在向下调整,现在能做可能只是捕捉反弹。不过要记得,
熊市的反弹一般都不太久,要见好就收。目前采取的方法是。。。
...


半年要 RM360 羅。。。我這個月才開始用的。。。

我是搜索股價剛剛碰觸到 50 天,100 天或是 200 天的均線的個股。。。

自己的觀察是如果股價跌破 200 天的年線。。。而且年線還保持向上的話通常都會上漲。。。

年線已經向下的就最好不要碰了。。。要碰的話最好是看月線。。。抓反彈就好。。。

今天搜索到的個股。。。看看有沒有希望拉。。。


Market: KLSE
Watchlist Name: Best Buy
Watchlist Components:
INIX
KINSTEL
KNM
MULPHA
PBBANK
POS
KLK
RAMUNIA
UEMBLDR
LIONIND
SPK
ASIATIC
PICORP
回复

使用道具 举报

发表于 4-7-2008 04:59 PM | 显示全部楼层

回复 193# ThermoFisher 的帖子

我喜欢PBB多一些。
回复

使用道具 举报

您需要登录后才可以回帖 登录 | 注册

本版积分规则


ADVERTISEMENT


ADVERTISEMENT


ADVERTISEMENT

ADVERTISEMENT


版权所有 © 1996-2023 Cari Internet Sdn Bhd (483575-W)|IPSERVERONE 提供云主机|广告刊登|关于我们|私隐权|免控|投诉|联络|脸书|佳礼资讯网

GMT+8, 5-5-2024 07:14 PM , Processed in 0.054318 second(s), 20 queries , Gzip On.

Powered by Discuz! X3.4

Copyright © 2001-2021, Tencent Cloud.

快速回复 返回顶部 返回列表